There’s a lot of diversity in project complexity where I work, but almost all of the projects start from comparing two or more groups of people. Sometimes the data come from the same source and can be processed around the same time, but for cases where samples are collected at different locations, or are too large to be processed at the same time, the issue of batch effects has to be addressed. The goal of these projects is often to find molecular features that are different between the groups of interest that are due to biology, and not because some of the samples of one group systemically received some noise (i.e. batch effect) that made them look different. To show-case when it’s possible to separate the signal (i.e. the true biological difference) from the noise, and when it’s not possible to do, I’ve found that some simple simulations can be helpful!
Scenario 1: Suppose you have two groups of people. One group receives a treatment and another is only given a placebo. At the end of a trial, you measure some feature of the two groups and want to know if the treatment caused a notable difference compared to the placebos. However, you decide to sequence the placebo group and the treated group in two completely separate batches! If the true treatment effect is 0 (i.e. the groups are not different with respect to the feature you are measuring), what could go wrong? To show-case this, I simulated 50 placebos and controls, where both have their observed feature values (before batch effects) drawn from the same normal distribution 


Now, if you’re thinking: why not include batch effect as a covariate in the linear model to remove its effect? Give it a try and see what happens! Depending on how you write the code, you should either get an “NA” (missing value) returned for your p-value for the treatment effect, or the same result as above (assuming the batch differences are large enough and enough samples).
Scenario 2: Same as Scenario 1, although this time there is a large treatment effect alongside the large batch effect difference, and the samples are (again) not mixed between batches. This time, we want to reject the null hypothesis that their is no difference between the means of the placebo and the control, and the simulations lead to a rejection rate (this time interpreted as power) of around 90%! Why does this work? In this case, the batch effect does not obscure the signal of a true difference, but actually artificially adds to it. The problem in a real-world setting is that you don’t always know whether you’re in Scenario 1 or Scenario 2 just be examining the data. This is the real pitfall of not properly mixing your two groups between batches that can kill an experiment before any analysis is performed.
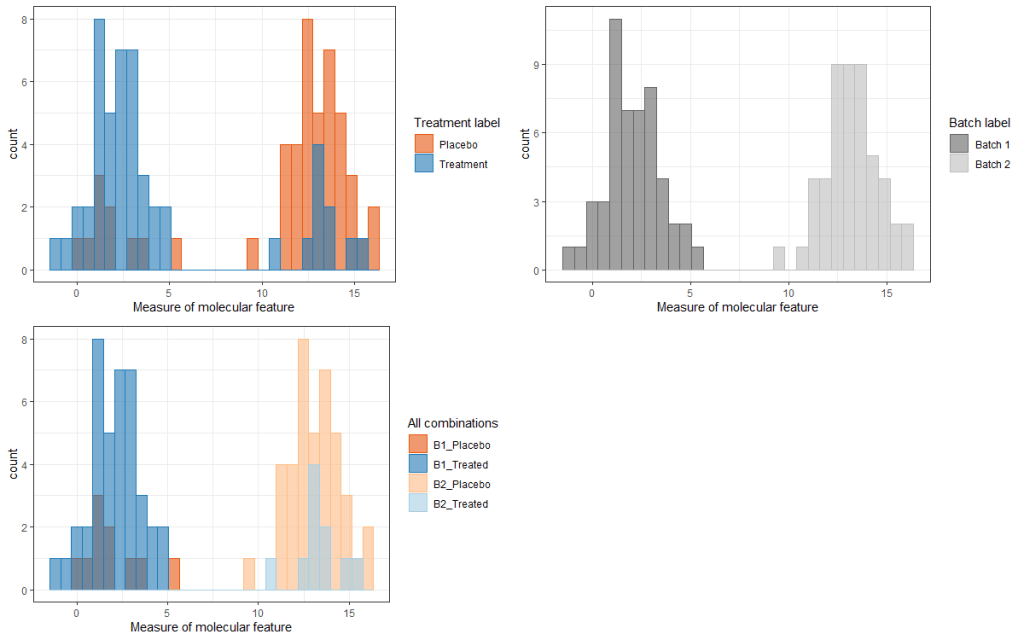
Scenario 3: What if we have no treatment effect, but this time we put a mixture of treated and control patients in each of our two batches? In this scenario, we can visualize the difference between batch effects and the non-existent treatment effect. In the figure below, the first plot (top left) shows two distinct clusters of the molecular feature, but this time the two clusters are not perfectly separated by assignment to treatment and control groups! Instead, if we only consider the batch effects in the second plot (top right), we see that the two well-separated clusters in the data line up perfectly with which batch the data came from. These simple visuals are again helpful, because they suggest the main driver of the two clusters of data are due to batch effects and not a true biological (treatment) effect. In fact, failing to account for the batch assignment in our linear regression models leads to a rejection rate (this time FPR) of close to 1, far above our intended rate of .05. Conversely, if we include the batch assignment in our linear models alongside the treatment assignment, the FPR drops to .056.